Analyzing Amazon Product Reviews: A Dashboard Overview

Listen Audio
0:00 / 0:00
Analyzing Amazon Product Reviews: A Dashboard Overview image Analyzing Amazon Product Reviews: A Dashboard Overview image Analyzing Amazon Product Reviews: A Dashboard Overview image Analyzing Amazon Product Reviews: A Dashboard Overview image

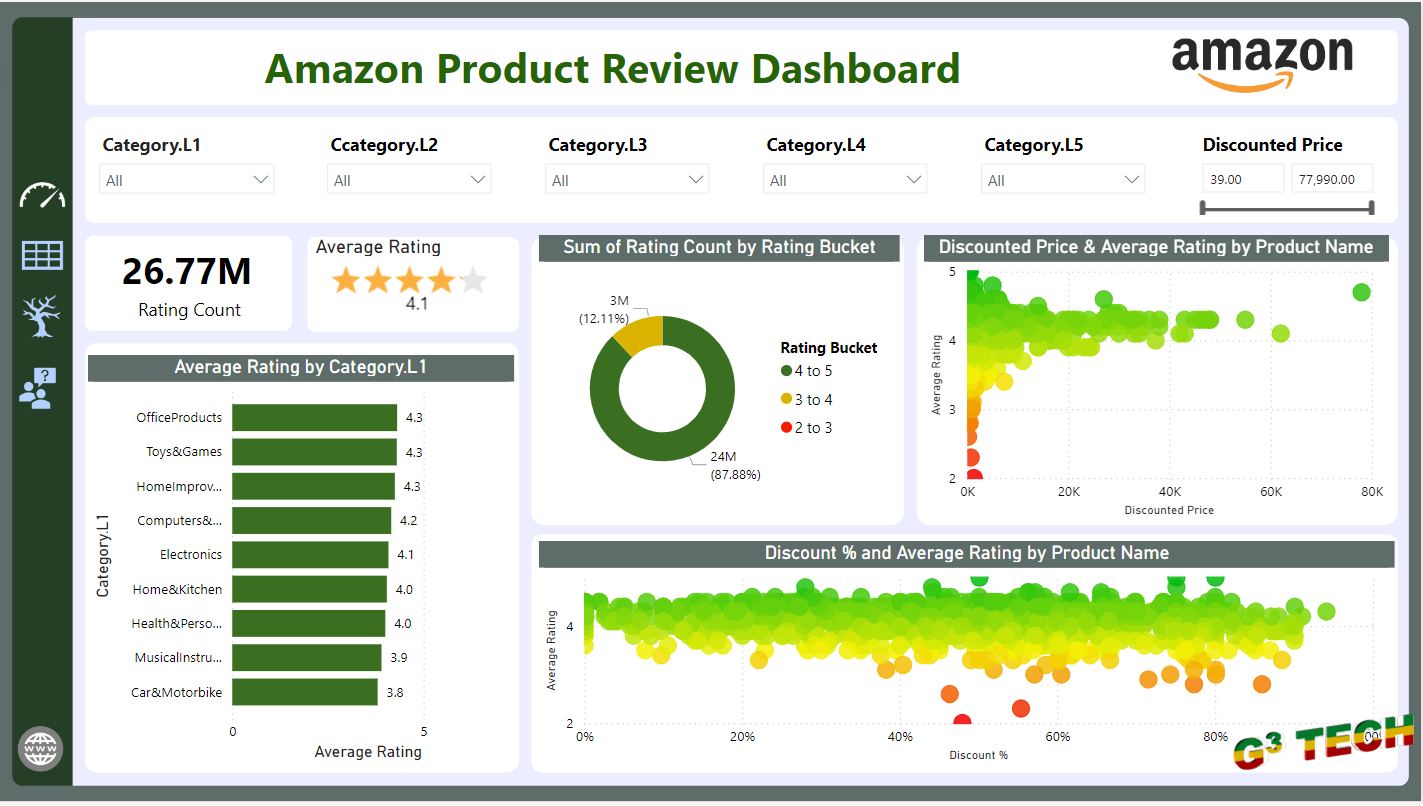
Welcome to our quick overview of an Amazon product review analysis! This dashboard is designed to help us understand how customers feel about products sold on Amazon. Here's a breakdown of the key insights it provides:

Key Metrics

  1. Rating Count: The dashboard shows a total of 26.77 million reviews. This large number helps us understand the volume of feedback Amazon products receive.

  2. Average Rating: The average rating across all products is 4.1 stars, indicating generally positive feedback from customers.

Category Insights

  • Category Breakdown: The dashboard allows us to filter reviews by various product categories like Office Products, Toys & Games, Home Improvement, and more. Each category has an average rating displayed, with Office Products and Toys & Games leading with a rating of 4.3 stars.

Rating Distribution

  • Rating Buckets: Reviews are grouped into three buckets based on their ratings:
    • 4 to 5 stars
    • 3 to 4 stars
    • 2 to 3 stars The majority of reviews (87.88%) fall into the 4 to 5-star bucket, showing high customer satisfaction.

Price and Rating Analysis

  • Discounted Price vs. Average Rating: This section of the dashboard shows how the discounted price of products correlates with their average ratings. It helps us understand if higher discounts lead to better or worse reviews.

  • Discount Percentage vs. Average Rating: This analysis helps to see if a discount percentage on a product affects its average rating.

Conclusion

This dashboard provides valuable insights into customer reviews on Amazon. By examining the average ratings, rating distribution, and the relationship between price and reviews, sellers can better understand customer preferences and improve their product offerings.

=>Stay tuned for more detailed analyses and insights on how to leverage customer feedback for better business decisions!


Leave a non public comment how to improve it.


Characters Remaining

We are sorry for your bad experience. Leave a non public comment how to improve it.


Characters Remaining

Related Posts (29)

Website Performance Analysis Report: A Key Tool for Improving Digital Strategy cover image Website Performance Analysis Report: A Key Tool for Improving Digital Strategy cover image Website Performance Analysis Report: A Key Tool for Improving Digital Strategy cover image
Call Center Power BI Report Overview cover image Call Center Power BI Report Overview cover image
Coffee Shop Sales Report Analysis using Power BI cover image Coffee Shop Sales Report Analysis using Power BI cover image
Comprehensive Road Accident Analysis using Power BI cover image Comprehensive Road Accident Analysis using Power BI cover image
Power BI Fitness Tracker Report cover image
City Bus Transportation Analysis with Power BI cover image City Bus Transportation Analysis with Power BI cover image City Bus Transportation Analysis with Power BI cover image City Bus Transportation Analysis with Power BI cover image
Leveraging Power BI for Insightful Reporting at Heavy Power Nutrition cover image
Toy Sales Analysis with Power BI cover image
Customer Performance Analysis with Power BI cover image Customer Performance Analysis with Power BI cover image
Analyzing Crime Trends With Power BI: A Detailed Overview cover image
Comprehensive Fleet Management Analysis with Power BI cover image Comprehensive Fleet Management Analysis with Power BI cover image Comprehensive Fleet Management Analysis with Power BI cover image Comprehensive Fleet Management Analysis with Power BI cover image Comprehensive Fleet Management Analysis with Power BI cover image
 Personal Finance Analysis with Power BI cover image
Ecommerce Sales Analysis with Power BI cover image
Sales Analysis and Salesperson Performance Report with Power BI cover image
Healthcare Analysis with Power BI cover image
Hotel Booking Analysis with Power BI cover image
Bicycle Sales Analysis with Power BI cover image
Ticket Sales Analysis and SLA Performance Report with Power BI cover image
Data Science: Unveiling Insights in a Data-Driven World cover image
Performance Analysis in PowerBI  cover image
Bookmark  cover image
Button action in Power BI cover image
Power BI as Application layout Interaction  cover image
Multithreading task in Power BI cover image
Analyzing Electric Vehicles using Power BI cover image Analyzing Electric Vehicles using Power BI cover image
Spotify Artist Analysis Report cover image

Share this on

Search

Archives

No archives data found yet in 2025.
No archives data found yet in 2016.

Find Us on Facebook

Subscribe for new updates


Back to Top