Comprehensive Road Accident Analysis Using Power BI

Listen Audio
0:00 / 0:00
Comprehensive Road Accident Analysis using Power BI image Comprehensive Road Accident Analysis using Power BI image

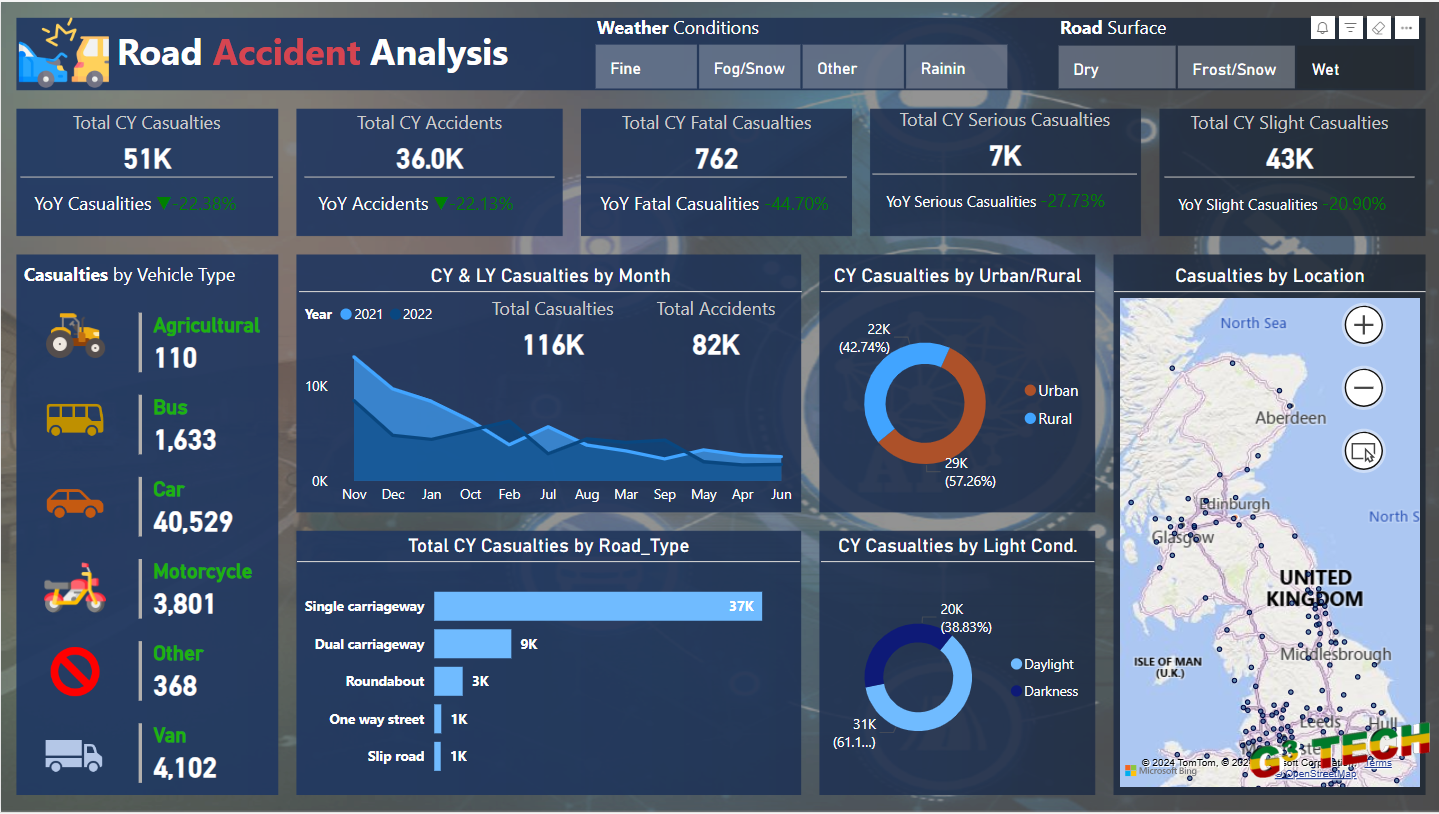
Understanding road accidents is very important for keeping people safe and planning better roads. This Power BI report helps us see patterns and details about road accidents. It helps us know where and when accidents happen most and who is most affected.

Main Goals

  1. See Accident Trends: This report shows accident trends for the current year (CY) and last year (LY). By comparing these years, we can see if things are getting better or worse.

  2. Casualty Categories: The report breaks down casualties by different vehicle types, road types, light conditions, and whether they happened in urban or rural areas. This helps us understand which situations are most dangerous.

  3. Monthly Breakdown: The report shows how accidents and casualties change month by month. This helps us see if certain times of the year are more dangerous.

  4. Location Insights: A map shows where accidents happen in the United Kingdom. This helps us find accident hotspots and focus on making those areas safer.

  5. Weather and Road Conditions: The report also examines how different weather and road conditions affect accidents. This helps us understand how to improve safety in different situations.

How to Use the Report

  1. Track Trends: Regularly check the report to see current trends and patterns in road accidents. Look for big changes to understand what’s happening and act quickly.

  2. Safety Campaigns: Use the data to create safety campaigns. For example, if there are many motorcycle accidents, focus on motorcycle safety.

  3. Plan Better Roads: Use the map to find and fix accident-prone areas. Improve road signs, repair roads, and add safety barriers where needed.

  4. Seasonal Safety: Look at the monthly data to prepare for times when accidents are more common. Add extra safety measures during these months.

  5. Specific Measures: Make safety plans based on weather and road conditions. For example, improve visibility in foggy areas with better lights and road markings.

Summary

This accident Power BI report is a helpful tool for anyone working on road safety and planning. It shows detailed data about road accidents, helping us make smart decisions to keep people safe. 


Leave a non public comment how to improve it.


Characters Remaining

We are sorry for your bad experience. Leave a non public comment how to improve it.


Characters Remaining

Related Posts (29)

Website Performance Analysis Report: A Key Tool for Improving Digital Strategy cover image Website Performance Analysis Report: A Key Tool for Improving Digital Strategy cover image Website Performance Analysis Report: A Key Tool for Improving Digital Strategy cover image
Call Center Power BI Report Overview cover image Call Center Power BI Report Overview cover image
Coffee Shop Sales Report Analysis using Power BI cover image Coffee Shop Sales Report Analysis using Power BI cover image
Power BI Fitness Tracker Report cover image
City Bus Transportation Analysis with Power BI cover image City Bus Transportation Analysis with Power BI cover image City Bus Transportation Analysis with Power BI cover image City Bus Transportation Analysis with Power BI cover image
Leveraging Power BI for Insightful Reporting at Heavy Power Nutrition cover image
Toy Sales Analysis with Power BI cover image
Customer Performance Analysis with Power BI cover image Customer Performance Analysis with Power BI cover image
Analyzing Crime Trends With Power BI: A Detailed Overview cover image
Comprehensive Fleet Management Analysis with Power BI cover image Comprehensive Fleet Management Analysis with Power BI cover image Comprehensive Fleet Management Analysis with Power BI cover image Comprehensive Fleet Management Analysis with Power BI cover image Comprehensive Fleet Management Analysis with Power BI cover image
 Personal Finance Analysis with Power BI cover image
Ecommerce Sales Analysis with Power BI cover image
Sales Analysis and Salesperson Performance Report with Power BI cover image
Healthcare Analysis with Power BI cover image
Hotel Booking Analysis with Power BI cover image
Bicycle Sales Analysis with Power BI cover image
Ticket Sales Analysis and SLA Performance Report with Power BI cover image
Data Science: Unveiling Insights in a Data-Driven World cover image
Performance Analysis in PowerBI  cover image
Bookmark  cover image
Button action in Power BI cover image
Power BI as Application layout Interaction  cover image
Multithreading task in Power BI cover image
Analyzing Electric Vehicles using Power BI cover image Analyzing Electric Vehicles using Power BI cover image
Analyzing Amazon Product Reviews: A Dashboard Overview cover image Analyzing Amazon Product Reviews: A Dashboard Overview cover image Analyzing Amazon Product Reviews: A Dashboard Overview cover image Analyzing Amazon Product Reviews: A Dashboard Overview cover image
Spotify Artist Analysis Report cover image

Share this on

Search

Archives

No archives data found yet in 2025.
No archives data found yet in 2016.

Find Us on Facebook

Subscribe for new updates


Back to Top