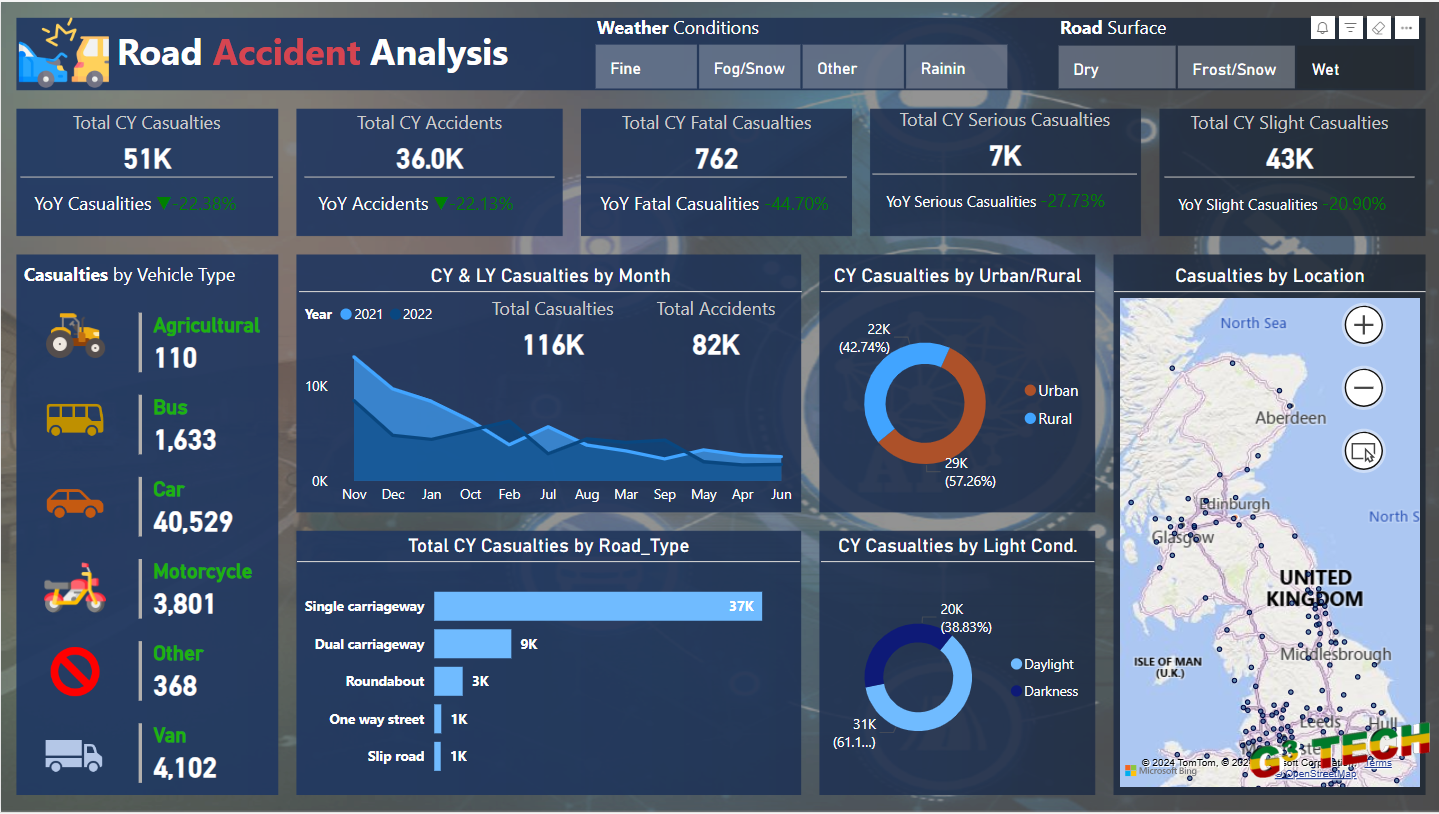
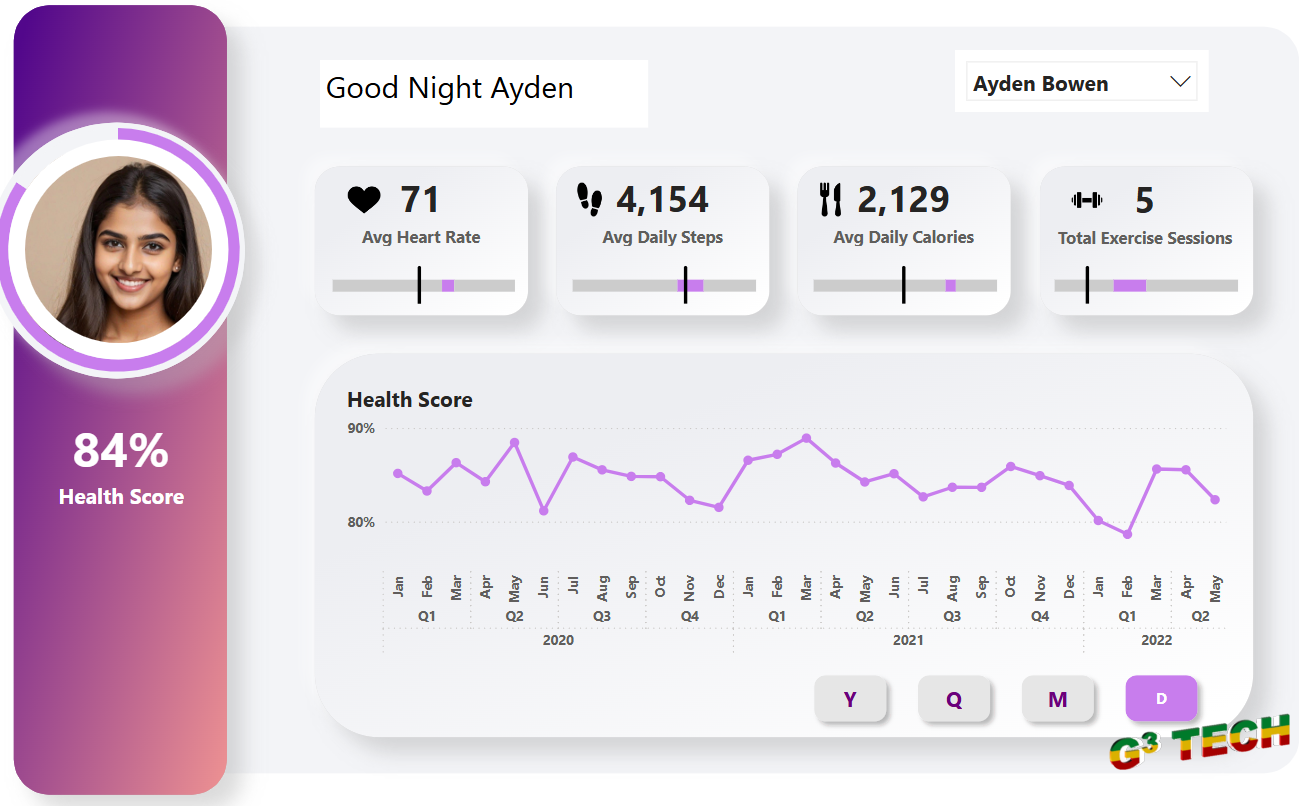
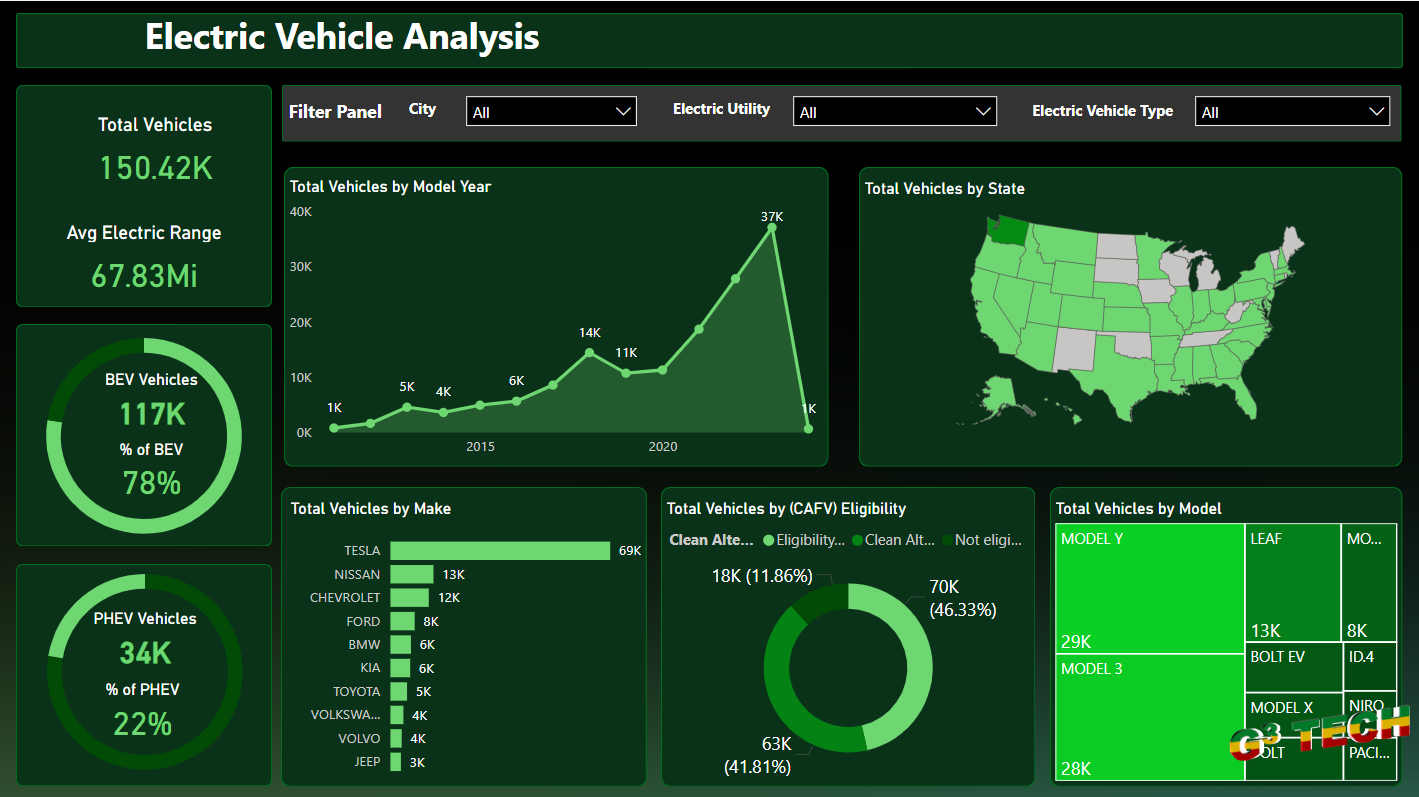
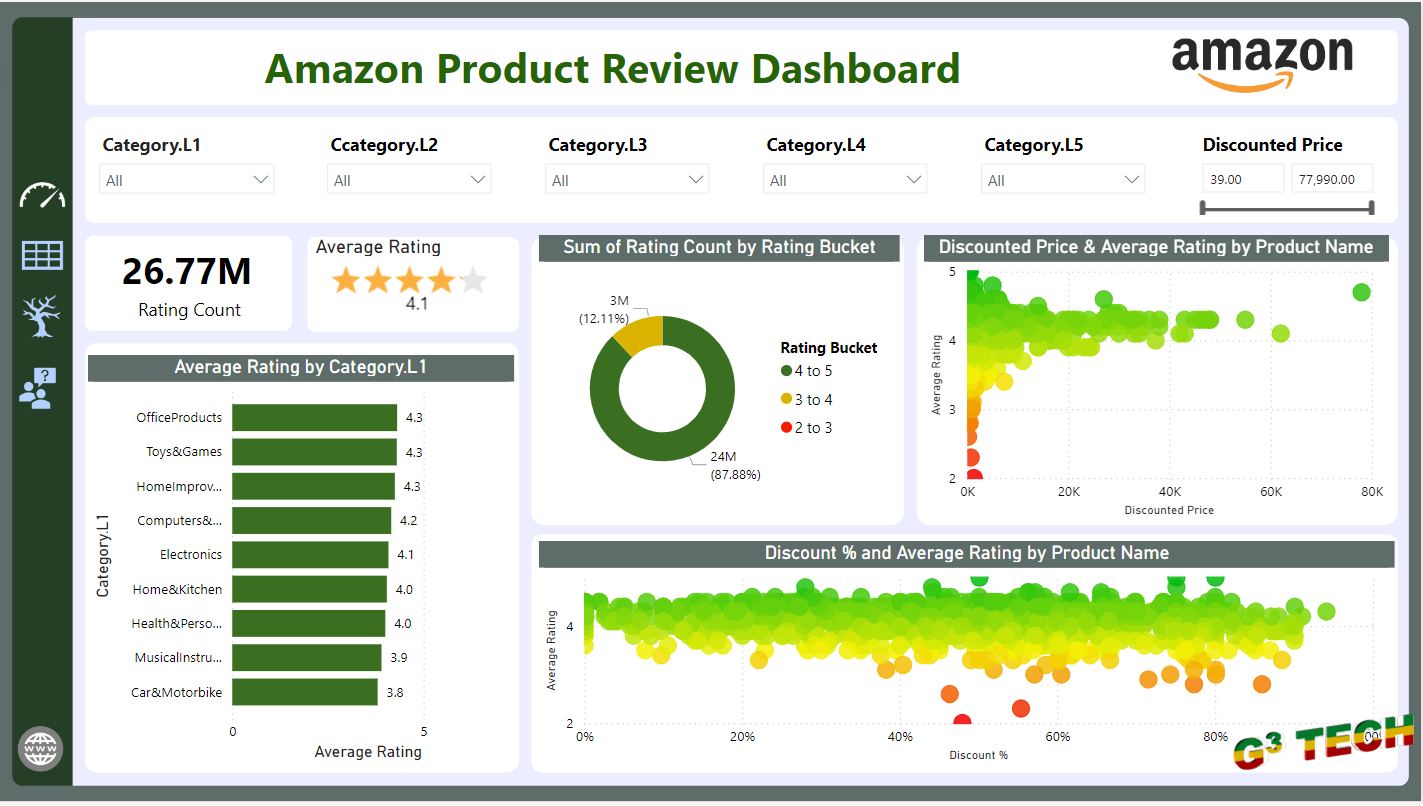
Effective analysis of e-commerce sales is critical for understanding market trends, customer preferences, and operational performance. Here’s overview of an e-commerce sales dashboard created in Power BI, showcasing key metrics and insights.
Key Metrics and Insights
1. YeartoDate (YTD) Sales and Profit:
Total YTD Sales and Profit: The dashboard highlights overall sales and profit for the year to date, providing a snapshot of the financial performance.
YearoverYear (YoY) Comparison: It includes YoY sales and profit comparisons, indicating growth trends or declines.
2. Sales by Category:
Category Performance: The dashboard breaks down sales by product category, showing YTD sales, previous YTD (PYTD) sales, and YoY percentage changes. This helps identify which categories are performing well and which need attention.
3. Top and Bottom Products by Sales:
Top 5 Products: Displays the top-performing products based on YTD sales, highlighting key revenue drivers.
Bottom 5 Products: Identifies the leastperforming products, providing insights into potential areas for improvement or discontinuation.
4. Sales by Region:
Geographical Distribution: A pie chart and map visualization show sales distribution across different regions, helping to identify regional strengths and opportunities.
5. Sales by State:
StateLevel Analysis: A map visualization provides detailed sales data by state, allowing for granular analysis of market performance.
6. Sales by Shipping Type:
Shipping Performance: The dashboard breaks down sales by shipping type, showing the contribution of each shipping method to overall sales. This helps in understanding customer preferences and logistics efficiency.
7. Profit Margin Analysis:
YTD Profit Margin: Displays the overall profit margin for the year, alongside YoY profit margin comparison. This metric is crucial for assessing the profitability of sales operations.
Insights and Recommendations
1. Focus on HighPerforming Categories:
Prioritize marketing and inventory management for categories that show strong sales and positive YoY growth.
2. Address Underperforming Products:
Analyze the reasons behind the poor performance of the bottom products and consider strategies like discounts, promotions, or product improvements.
3. Regional Sales Strategies:
Tailor marketing and sales strategies to leverage strong regions and address challenges in weaker regions. The geographical sales data can guide resource allocation and campaign targeting.
4. Optimize Shipping Options:
Review the performance of different shipping types to ensure that the most preferred and cost-effective options are prioritized. This can enhance customer satisfaction and operational efficiency.
5. Monitor Profit Margins:
Continuously track profit margins to ensure that sales growth translates into profitability. Implement cost control measures if profit margins are declining.
Conclusion
The E-commerce Sales Dashboard in Power BI offers a powerful tool for analyzing sales data across multiple dimensions. By leveraging these insights, businesses can make data-driven decisions to optimize their product offerings, improve regional performance, and enhance overall profitability. Explore the dashboard to gain deeper insights into your e-commerce operations and drive better business outcomes.


