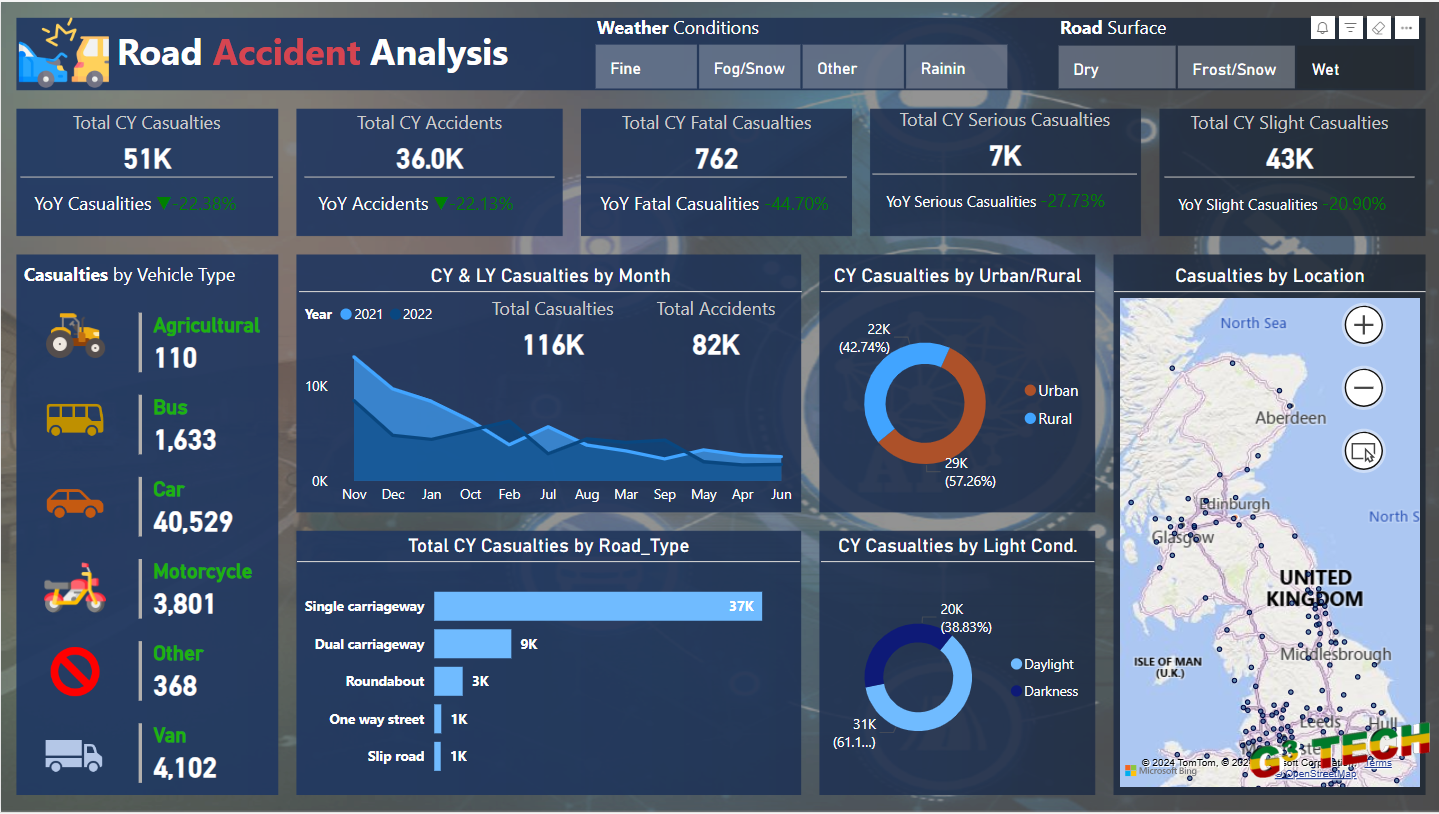
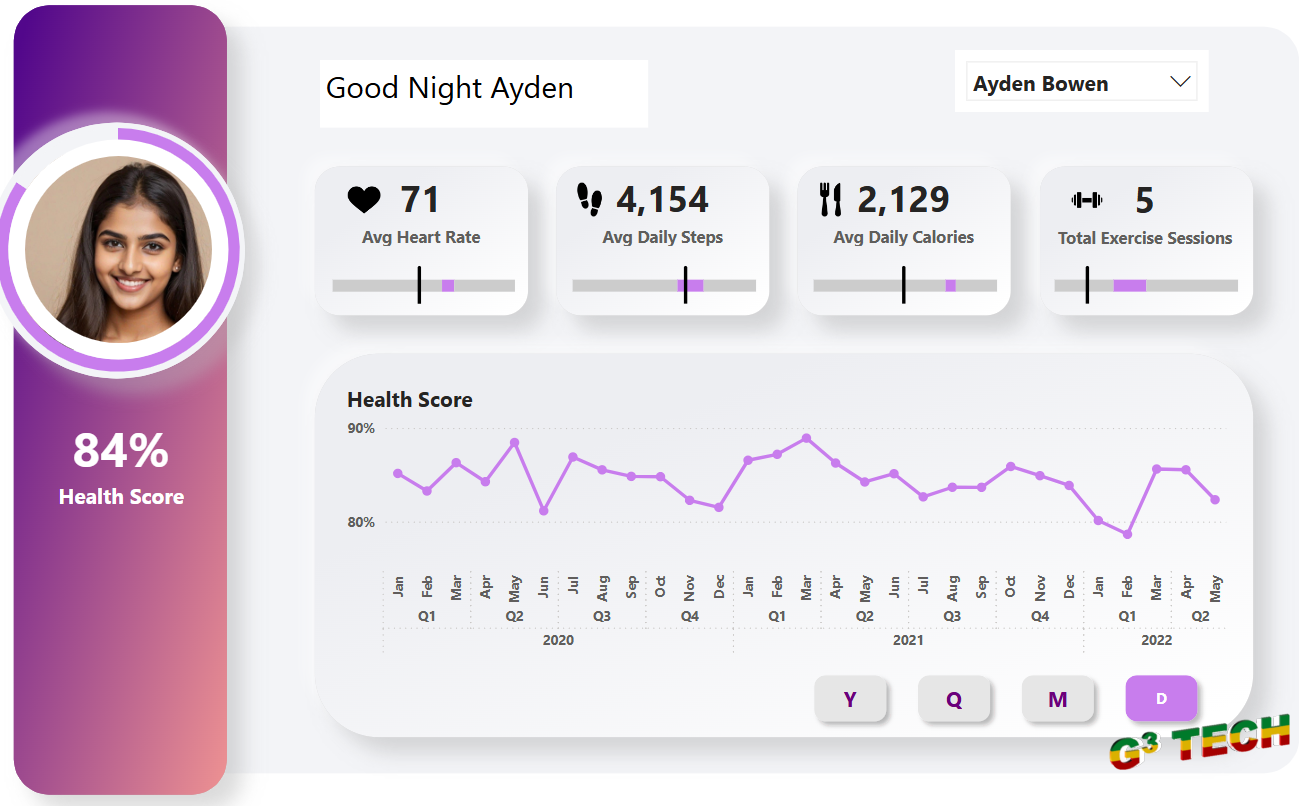
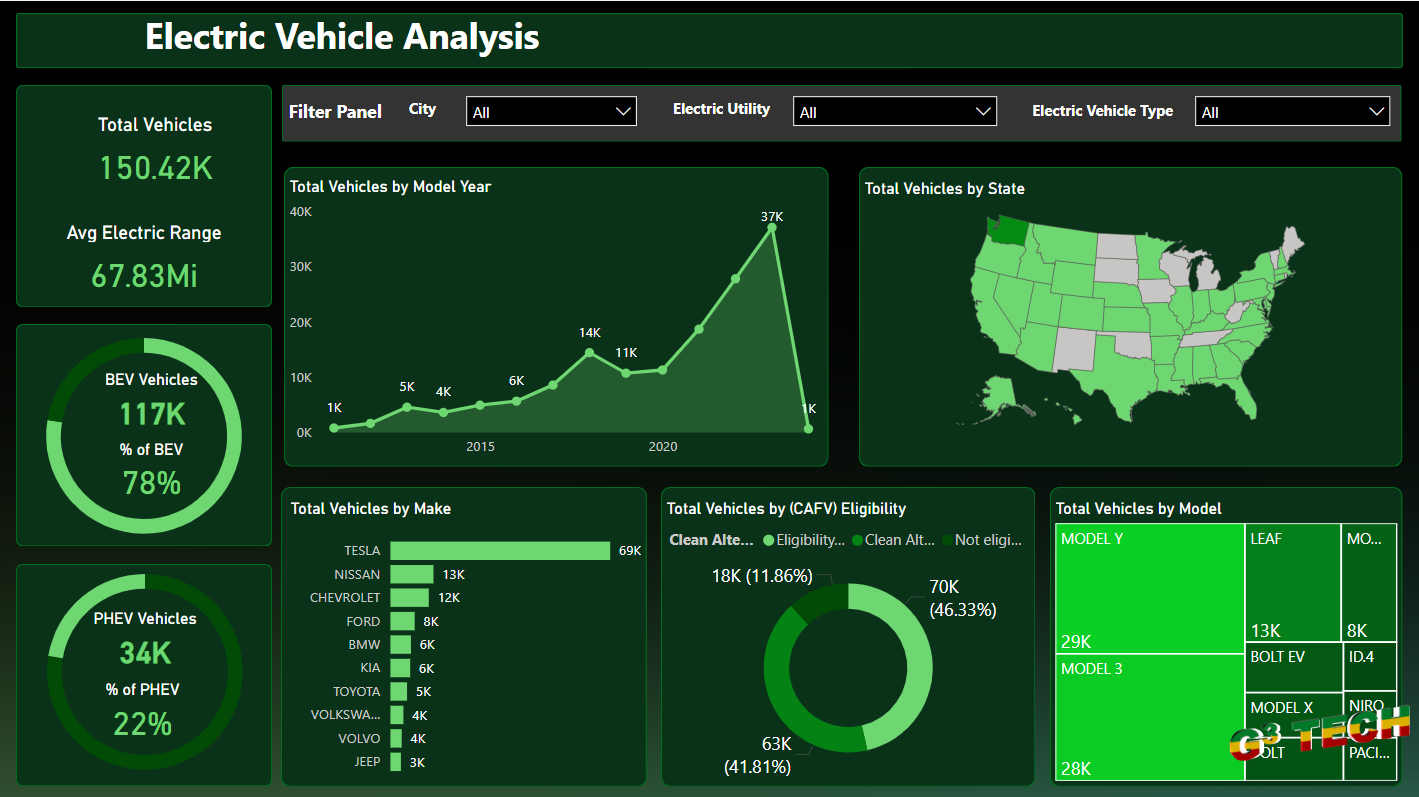
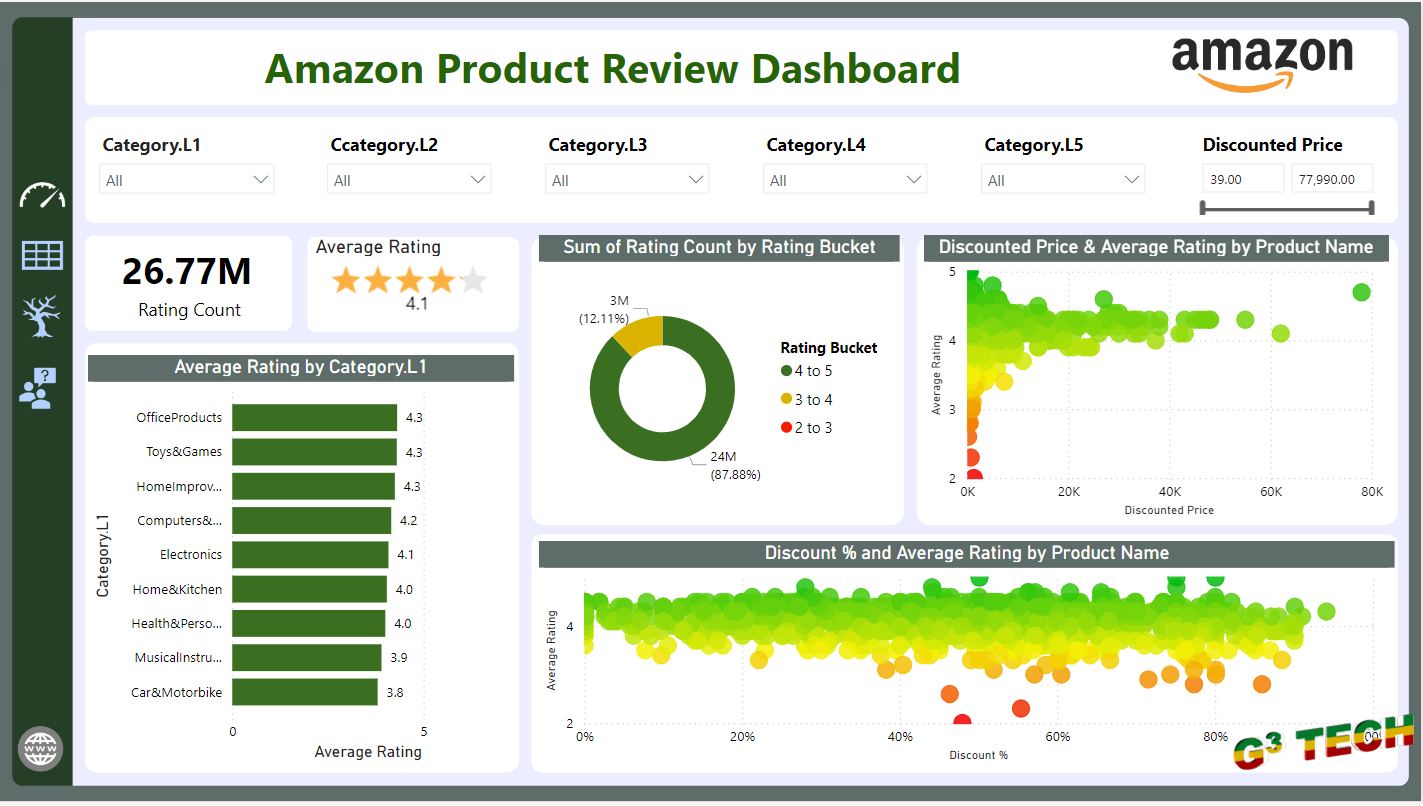
Analyzing healthcare data is essential for improving patient care and operational efficiency. Power BI provides a comprehensive platform for visualizing and analyzing healthcare metrics. Here’s an overview of a healthcare analysis dashboard created in Power BI.
Key Metrics and Insights
1. Total Patients:
Displays the total number of patients, along with a breakdown of admission versus nonadmission appointments.
2. Patient Demographics:
Gender Distribution: Shows the percentage of male and female patients.
Age Group Distribution: Analyzes the total number of patients by different age groups, from infants to adults.
3. Patient Satisfaction and Wait Time:
Average Satisfaction Score: Provides an average patient satisfaction score.
Average Wait Time: Highlights the average wait time for patients, which is crucial for assessing service efficiency.
4. Patient Visits by Time and Week:
Weekday vs. Weekend Visits: Breaks down patient visits by weekdays and weekends to identify peak times.
Visits by Time of Day: Analyzes visits during AM and PM hours.
5. Patient Referrals:
Referral Distribution: Shows the percentage of patients referred by different departments, such as General Practice, Orthopedics, and Cardiology.
6. Yearly Trends:
Total Patients by Year: Displays the trend of patient visits over the years, indicating growth or decline.
7. Satisfaction by Demographics:
Satisfaction Heatmap: Shows patient satisfaction scores across different racial groups and age categories.
Insights and Recommendations
1. Improving Wait Times:
Focus on reducing wait times to enhance patient satisfaction and operational efficiency.
2. Targeted Care for Age Groups:
Tailor healthcare services to meet the needs of different age groups, especially those with higher visit rates.
3. GenderSpecific Health Programs:
Develop targeted health programs based on the gender distribution of patients.
4. Optimizing Peak Hours:
Adjust staffing and resources to better handle peak hours identified in the weekday and weekend visit analysis.
5. Referral Program Efficiency:
Analyze referral patterns to improve collaboration between departments and streamline patient care processes.
Summary
The Healthcare Analysis Dashboard in Power BI provides a comprehensive view of patient demographics, satisfaction, and operational metrics. By leveraging these insights, healthcare providers can optimize their services, improve patient care, and enhance overall efficiency. Explore the dashboard to gain deeper insights into your healthcare operations and drive better decision-making.
If you have any questions or need further details, feel free to comment below. We are here to help you make the most out of your healthcare data.


