Performance Analysis In PowerBI

Listen Audio
0:00 / 0:00
Performance Analysis in PowerBI  image

Data insight using a Power BI is fun.

1. Performance Insight:
   - Performance insight refers to the analysis of various metrics and key performance indicators (KPIs) to evaluate the success or effectiveness of a particular aspect of a business, such as a product, marketing campaign, or team.
   - It involves monitoring and assessing metrics like revenue, sales, customer satisfaction, and other relevant data to understand how well a particular area of the business is performing.
   - Performance insights help businesses identify areas for improvement and make data-driven decisions to optimize their operations.

2. Cohort Analysis:
   - Cohort analysis is a technique used in data analysis to study and compare groups of users or customers (cohorts) who share common characteristics or experiences over time.
   - For example, you can create cohorts based on the month a customer first signed up for a service. Then, you can analyze how the behavior and engagement of each cohort evolve over subsequent months.
   - Cohort analysis helps businesses understand user retention, customer lifetime value, and the impact of changes or events on different groups of users.

3. Scenario Event Analysis:
   - Scenario event analysis involves examining historical data to understand how specific events or scenarios have affected a business or system's performance.
   - Businesses use this analysis to model and predict the potential outcomes of different scenarios, which can be valuable for risk assessment and strategic planning.
   - For instance, a retail company might use scenario event analysis to evaluate how changes in pricing, seasonal events, or economic factors impact sales and profitability.

In summary, performance insight focuses on assessing the success of various aspects of a business, cohort analysis helps understand user behavior over time among different groups, and scenario event analysis involves studying historical data to assess the impact of specific events or scenarios on business performance. These techniques are essential for data-driven decision-making and strategic planning.


Leave a non public comment how to improve it.


Characters Remaining

We are sorry for your bad experience. Leave a non public comment how to improve it.


Characters Remaining

Related Posts (29)

Website Performance Analysis Report: A Key Tool for Improving Digital Strategy image Website Performance Analysis Report: A Key Tool for Improving Digital Strategy image Website Performance Analysis Report: A Key Tool for Improving Digital Strategy image
Call Center Power BI Report Overview image Call Center Power BI Report Overview image
Coffee Shop Sales Report Analysis using Power BI image Coffee Shop Sales Report Analysis using Power BI image
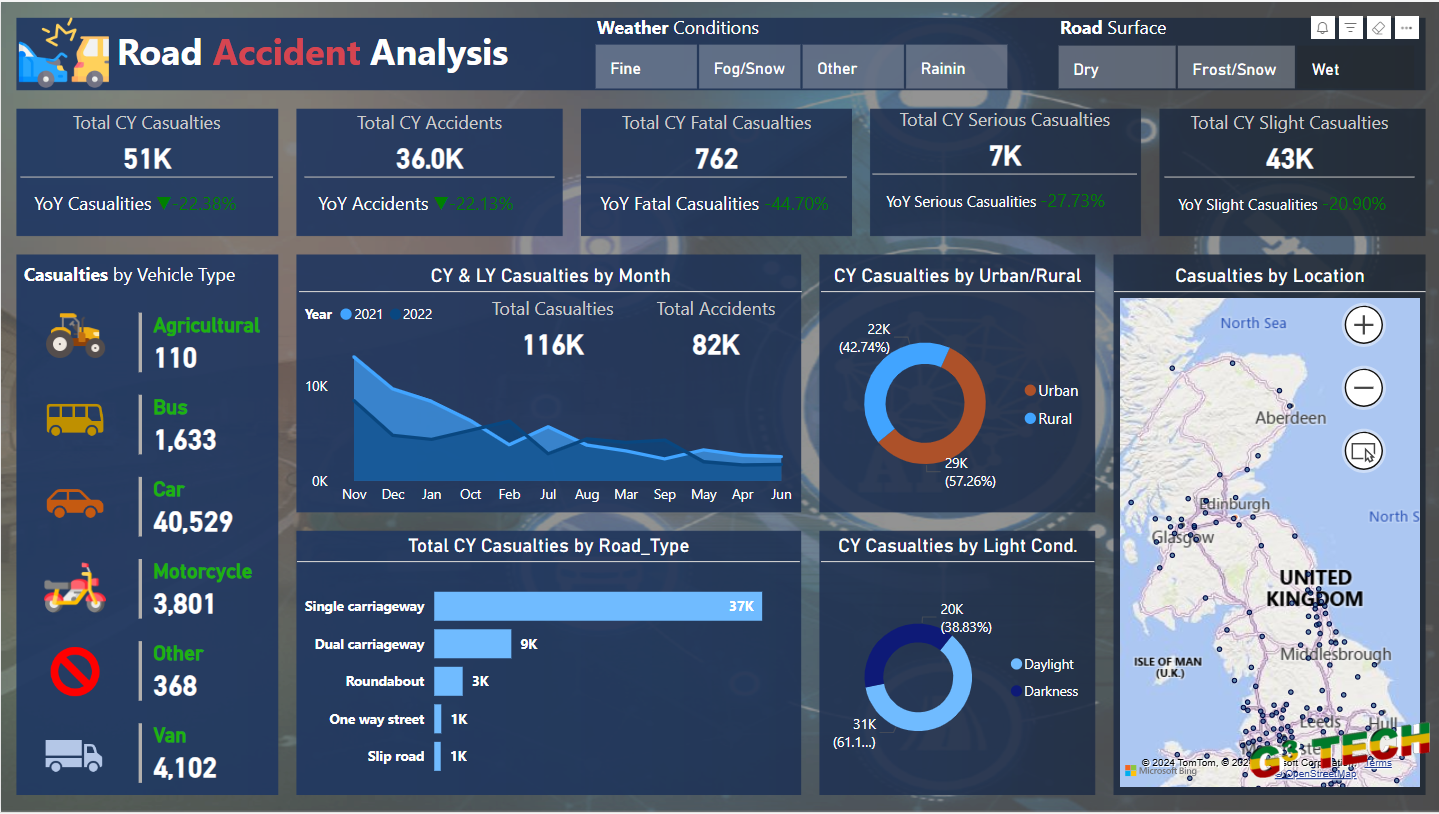
Comprehensive Road Accident Analysis using Power BI image Comprehensive Road Accident Analysis using Power BI image
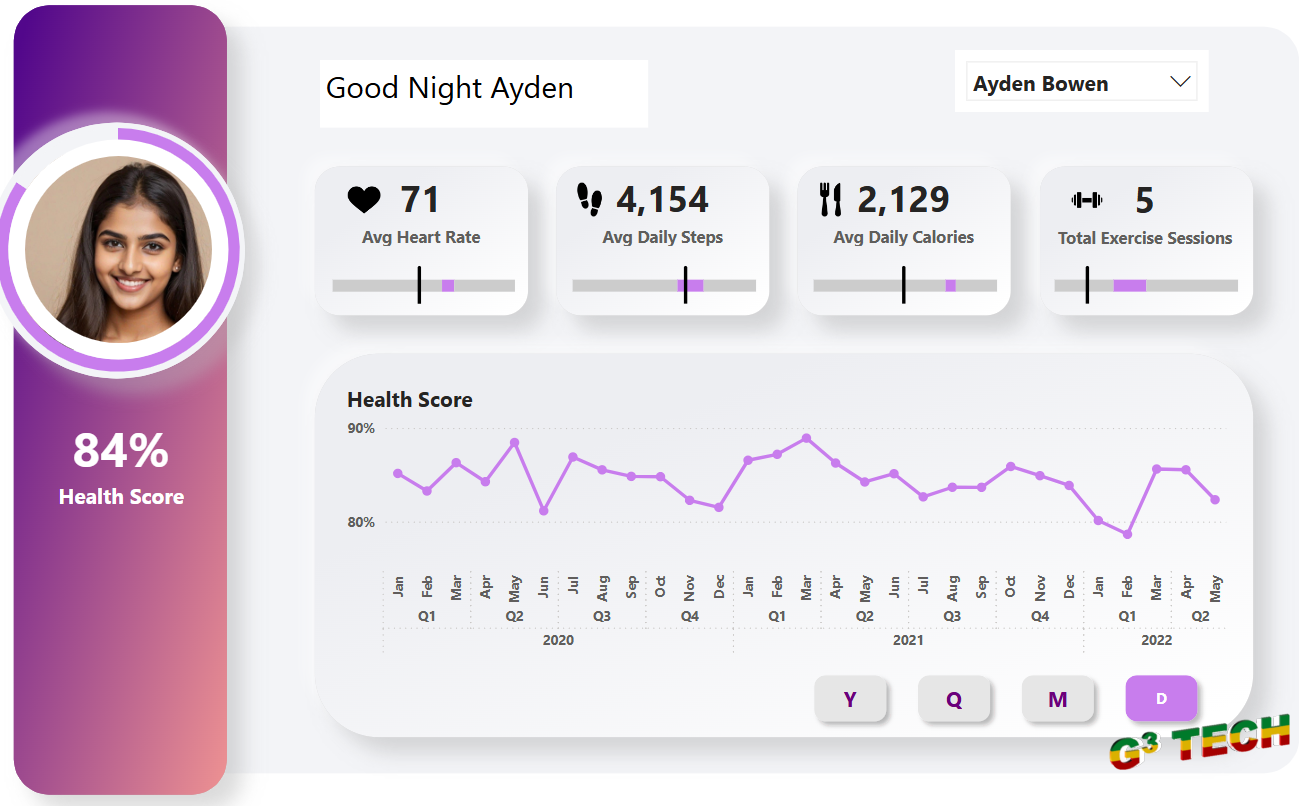
Power BI Fitness Tracker Report image
City Bus Transportation Analysis with Power BI image City Bus Transportation Analysis with Power BI image City Bus Transportation Analysis with Power BI image City Bus Transportation Analysis with Power BI image
Leveraging Power BI for Insightful Reporting at Heavy Power Nutrition image
Toy Sales Analysis with Power BI image
Customer Performance Analysis with Power BI image Customer Performance Analysis with Power BI image
Analyzing Crime Trends With Power BI: A Detailed Overview image
Comprehensive Fleet Management Analysis with Power BI image Comprehensive Fleet Management Analysis with Power BI image Comprehensive Fleet Management Analysis with Power BI image Comprehensive Fleet Management Analysis with Power BI image Comprehensive Fleet Management Analysis with Power BI image
 Personal Finance Analysis with Power BI image
Ecommerce Sales Analysis with Power BI image
Sales Analysis and Salesperson Performance Report with Power BI image
Healthcare Analysis with Power BI image
Hotel Booking Analysis with Power BI image
Bicycle Sales Analysis with Power BI image
Ticket Sales Analysis and SLA Performance Report with Power BI image
Data Science: Unveiling Insights in a Data-Driven World image
Bookmark  image
Button action in Power BI image
Power BI as Application layout Interaction  image
Multithreading task in Power BI image
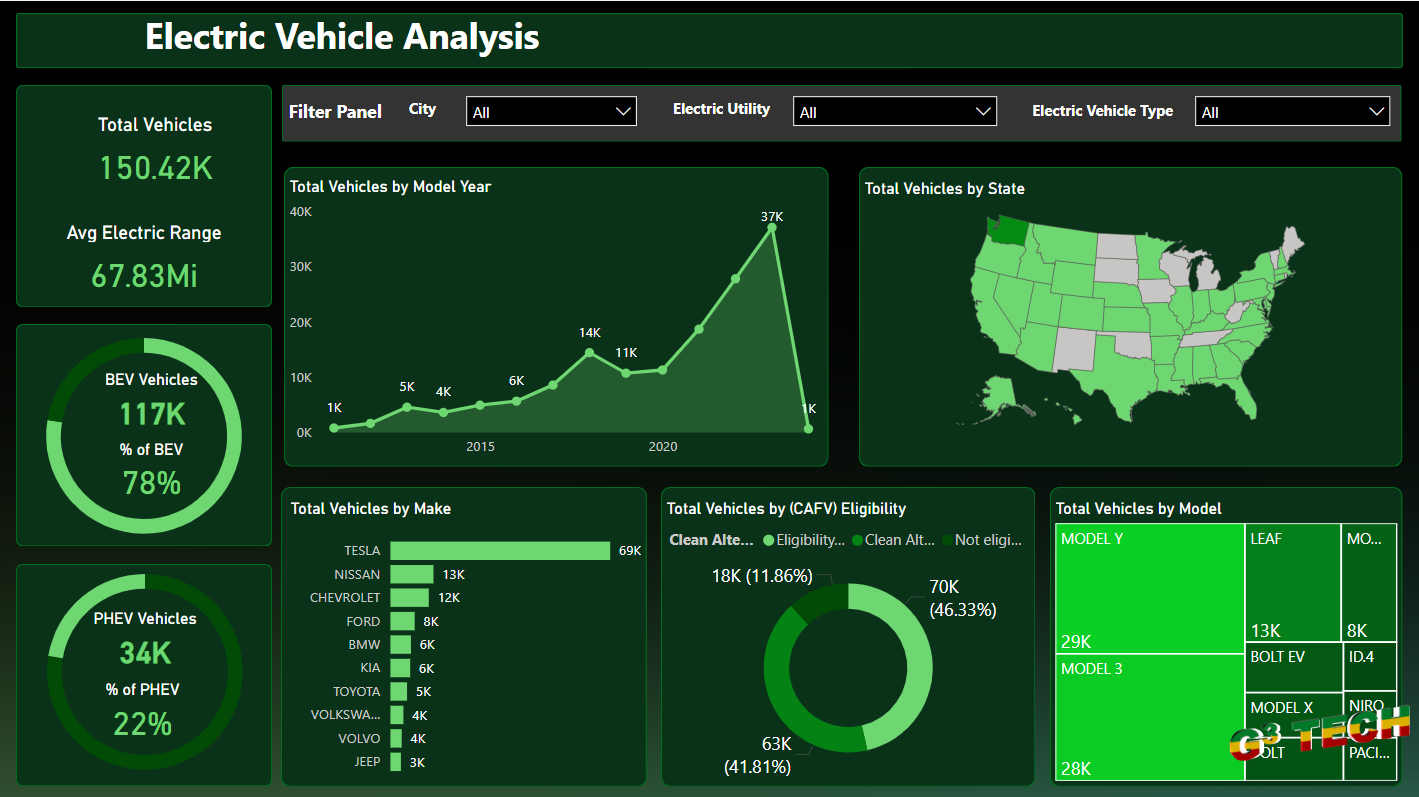
Analyzing Electric Vehicles using Power BI image Analyzing Electric Vehicles using Power BI image
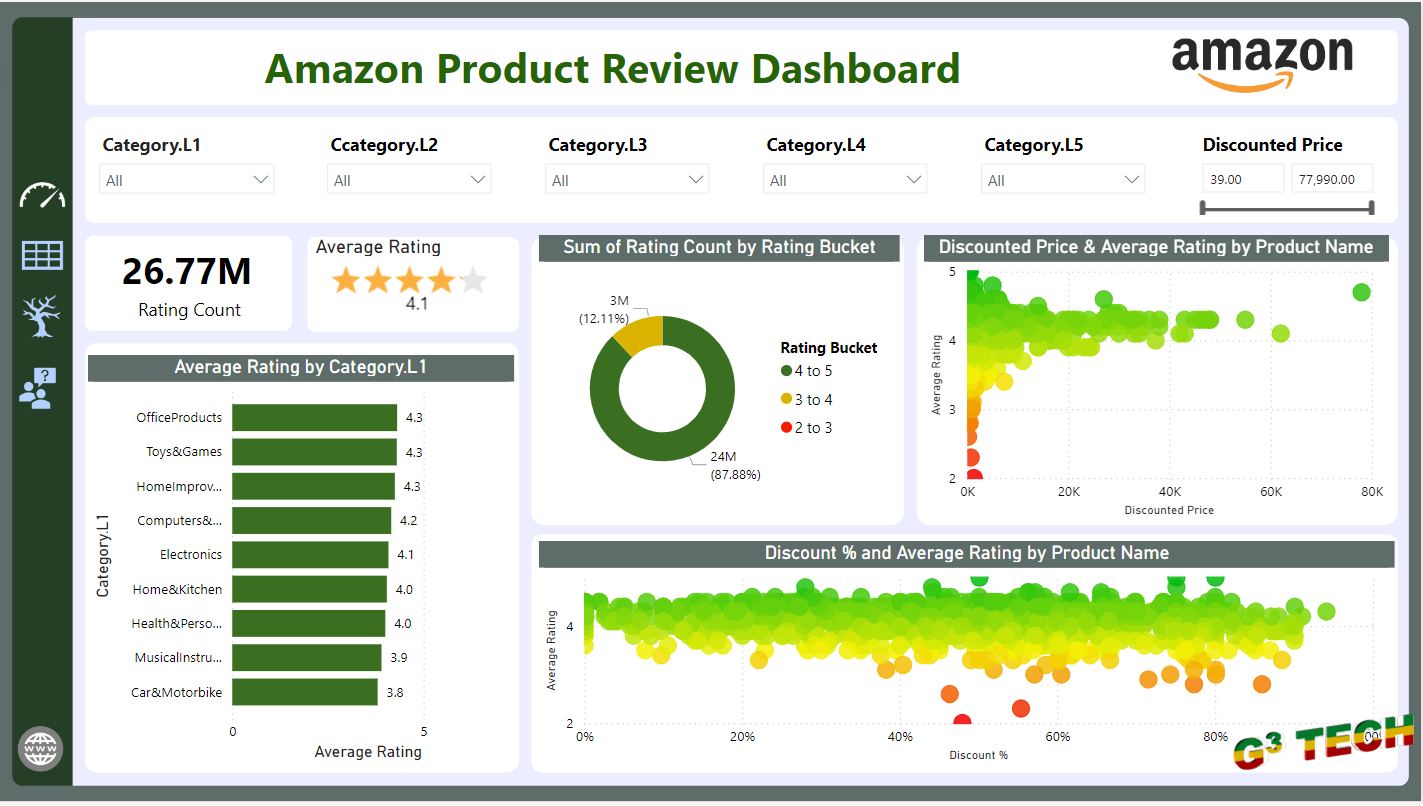
Analyzing Amazon Product Reviews: A Dashboard Overview image Analyzing Amazon Product Reviews: A Dashboard Overview image Analyzing Amazon Product Reviews: A Dashboard Overview image Analyzing Amazon Product Reviews: A Dashboard Overview image
Spotify Artist Analysis Report image

Share this on

Search


Archives

No archives data found yet in 2016.

Find Us on Facebook

Subscribe for new updates


Back to Top