Maintaining a healthy lifestyle can be challenging in today's fast-paced world. However, with the advent of technology, tracking and managing our health metrics has become more accessible and insightful. One such technological marvel is the Power BI Fitness Tracker Report. This interactive dashboard provides a comprehensive view of an individual's health metrics, offering valuable insights to help users make informed decisions about their fitness journey.
Overview of the Fitness Tracker Report
The Power BI Fitness Tracker Report is a visually appealing and highly functional dashboard designed to track various health parameters. The report displayed here is a testament to the capabilities of Power BI in transforming raw data into actionable insights. Let's dive into the features and functionalities of this report.
Key Features
-
Personalized Health Summary:
- The report starts with a personalized greeting, making the user feel engaged and connected.
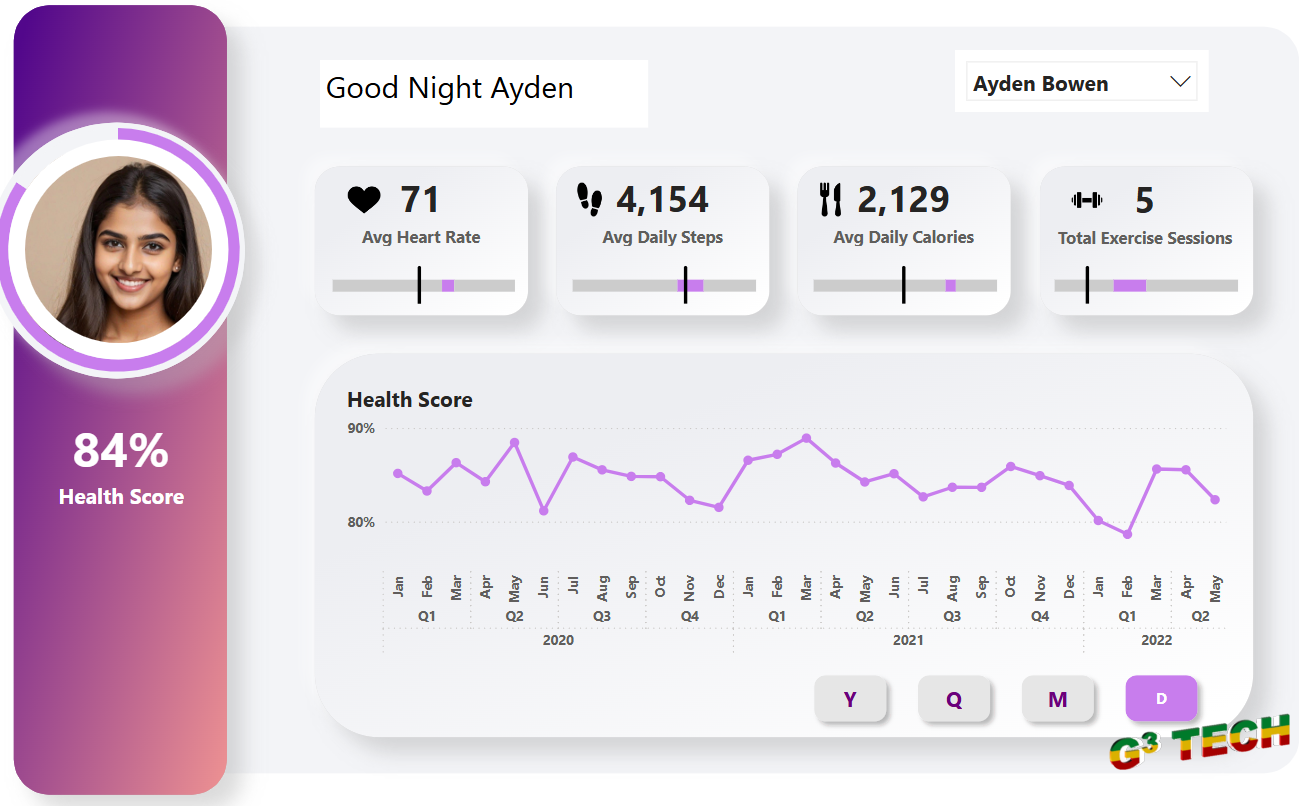
- A health score is prominently displayed, giving a quick snapshot of the user's overall health status. In this case, Ayden has a health score of 84%, indicating a good health condition.
-
Vital Health Metrics:
- Average Heart Rate: The report shows Ayden's average heart rate at 71 bpm, providing insights into cardiovascular health.
- Average Daily Steps: With 4,154 steps on average, users can track their daily activity levels and strive to meet their fitness goals.
- Average Daily Calories: Ayden's average daily caloric intake is 2,129 calories, helping in monitoring dietary habits.
- Total Exercise Sessions: The report also tracks the number of exercise sessions, with Ayden having completed 5 sessions, indicating physical activity levels.
-
Trend Analysis:
- The health score trend graph provides a historical view of the user's health score over time. This helps in identifying patterns, progress, and areas needing improvement.
- Users can filter the trend analysis by year (Y), quarter (Q), month (M), or day (D), allowing for granular insights into their health metrics.
Benefits of the Power BI Fitness Tracker Report
-
Data-Driven Insights:
- By consolidating various health metrics into one dashboard, users can make data-driven decisions about their health and fitness routines.
- Trend analysis helps in understanding the long-term impact of lifestyle changes and adjustments.
-
Personalization:
- The personalized greeting and health summary create a user-friendly experience, making it more likely for individuals to engage with and utilize the report regularly.
-
Motivation and Accountability:
- Seeing tangible metrics and trends can motivate users to maintain or improve their health habits.
- Tracking progress over time fosters a sense of accountability, encouraging consistent effort towards fitness goals.
-
Comprehensive Health Monitoring:
- The integration of various health parameters provides a holistic view of an individual's well-being, going beyond simple step counts or calorie tracking.
Conclusion
The Power BI Fitness Tracker Report is a powerful tool for anyone looking to monitor and improve their health. Its comprehensive approach to tracking vital health metrics, combined with the ability to analyze trends over time, makes it an invaluable resource for making informed health decisions. Whether you're a fitness enthusiast or someone looking to start their wellness journey, this report offers the insights and motivation needed to achieve your health goals.


